How to use the T-test and F-test in a real world【Excel Function】

Today’s topic is the T-test and F-test and their Excel functions. The T-test is used to compare two data groups’ averages and the F-test is used during the process of obtaining the T-test’s result.
(Duration: 8:03)
<< Related Posts >>
- Process Capability Basics, Cp and Cpk Deference and Unilateral Tolerance
- What is Standard Deviation? There are too many Excel functions for Standard Deviation!
What are the T-test and F-test?
Hi, this is Mike Negami, Lean Sigma Black Belt.
I received this video request:

“Can you make a video about the following topic, Data test (T-test, F-test)?”
Tung Vu, thank you for your request. It may be a difficult statistics topic today, but I’ll talk about its practical usage as simply as I can.
There are many types of data tests, but I think that the T-test is the most useful and has many applications. The F-test is used during the process of obtaining the result of the T-test. The T-test is used to compare two data groups’ averages. For example, you can compare the data before and after you run the sales campaign and examine the campaign’s effects, or compare the performance of two production lines.
Perhaps, some of you may think “Calculating averages and comparing them is easy.” However, average values are influenced greatly by outliers and sometimes cause misleading conclusions. You can scientifically examine whether the two data groups had significant differences with the T-Test.
T-test’s Excel function: How to use the T.TEST function
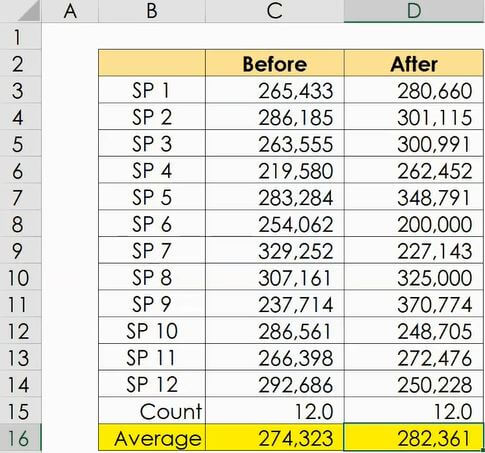
Here are sales data by salesperson from before and after a sales campaign. I got their averages with the AVERAGE function. The ‘After’ average is higher (See Cell D16). Is it okay to decide that the campaign was successful? We can confirm it with the T-test.
Its Excel function is the T.TEST function. Type ‘=T.TEST(‘, then you’ll see an explanation of its argument. The first 2 arguments, ‘array1’ and ‘array2’ are for selecting your data to compare. Select one of your data ranges with your mouse, then put a comma after it. Select the other data range and put another comma.

The third one is the ‘tails’. Put 1 for ‘One-tailed distribution’ or 2 for ‘Two-tailed distribution’. This will be dependent on the purpose of your test. I’ll not talk in detail about this today, but in many cases, you may put 2 for the ‘Two-tailed distribution’.
The last argument is the ‘type’. This depends on the condition of your data. I’ll explain more later, but here I use 1 for ‘Paired’. After closing the parenthesis and pressing the enter key, we got 0.660. This value is called the P-value.
How to interpret the P-value, the result of the T-test
The P-value has many complex statistical meanings, but for practical purposes, it represents the probability that there is no difference between the two data groups selected. Our result, 0.66 is saying that there is no difference between the two data groups with a probability of 66%. Here we want to see the effect of the sales campaign. With the 66% probability, can we tell if the data groups have a significant difference or not?
In general, if the P-value is less than 5%, you can judge there is a significant difference. In other words, “Since the ‘probability of no difference’ is low, there is a ‘difference’.” In that case, you can tell that the campaign has been effective.

However, we got 66% and the ‘probability of no difference’ is high this time, so we concluded that the campaign was not effective. Since Excel will do all the difficult calculations for us, please learn well how to interpret the values that come out of the calculation.
The reason to use the F-test
One important topic is left to discuss. The ‘type’ for the last argument in the function. I chose ‘1’ as ‘Paired’ earlier. This was because the data groups we used were a pair of each salesperson’s sales data before and after the sales campaign.

On the other hand, if you need to compare the sales of Branch A and Branch B, the salespeople are completely different and none of the numbers would be paired. In this case, since the data is not ‘Paired’, you would choose ‘2’ for ‘Two-sample equal variance’ or ‘3’ for ‘Two-sample unequal variance’. Variance is the degree of variation in data. By the way, the number of data does not have to be the same in these cases.
Choose ‘2’ if the two data groups have similar variances, and choose ‘3’ if not. Now, how can we decide which one to use? Here we’ll use today’s other theme, the F-test.
In Excel, we’ll use the F.TEST Function. Type until a parenthesis and see the structure of arguments. We just need to select the ranges of the two data groups to compare.

I’ll select them, then I got 0.104. This result is also called the P-value and means that the probability that there is no difference in each variance is 10.4%. Similar to the T-test, unless it’s 5% or less, you can’t say that there is a difference, so the two data groups have equal variances.
Conclusion of the F-test
Go back to the T.TEST function and choose ‘2’ for the equal variance one. The result is not 5% or less, so these two data groups statistically don’t have a significant difference.
Let me summarize. When you want to compare two data groups:
- Prepare the data.
- Decide whether to use One-tailed or Two-tailed distribution.
- Check whether your data groups are ‘Paired’ or not.
- If it’s not ‘Paired‘, use the F.TEST function to check if they have equal variances.
- Apply all gathered information into the T.TEST function. If the result is 5% or less, the two data groups have a significant difference.
Today I only talked about the practical parts of the T-Test and F-Test. I let Excel handle the fundamental parts, but I recommend that you study the basics of the data tests and statistics as well.