VSM 5 Steps of Value Stream Mapping 【Excel Template】

With this Value Stream Map, you can see the big picture when you analyze your current work flow situation. Also, when you re-design an existing process or you want to design a brand-new process, this Value Stream Mapping works powerfully.
(Duration: 5:06)
DOWNLOAD ← Click this to download the “Value Stream Mapping” template file.
<< Related Posts >>
How to make a Value Stream Map (VSM)
Hi, this is Mike Negami, Lean Sigma Black Belt.
We’ll practice how to draw a Value Stream Mapping that Toyota Production System created, using an Excel template. You can download this template by clicking the link below:\
DOWNLOAD ← Click this to download the “Value Stream Mapping” template file.
This is the template. It uses Macro, so click the buttons above your formula bar after downloading the file.
(Click the image below to enlarge the image.)

There are 12 hyperlinks on the right. Clicking each link makes a respective shape that is used in Value Stream Mapping for non-manufacturing processes.
For example, click those links: Object Flow Icon, Information Flow Icon and Process Step Icon. Drag them to draw a Map to describe your process.
1. Conduct a SIPOC Analysis.
However, before drawing a Value Stream Map, you should complete a SIPOC Analysis on your process. I talked about how to make a SIPOC Analysis in the prior video. Please watch that too.
<< Related Posts >>
This is a result of the SIPOC Analysis. You can make a list of objects and information that come into and out of each process step.

2. Make all process step icons.
First, make all process step icons. Click the link, ‘Process Step’. Type a department name in the upper square and its process procedure in the square below. Make all process steps icon and it will look like this.

Traditionally we put the 1st step in the upper-left corner and lay out the other steps counter-clock wise from it, but since you’ll change the arrangement as you continue, you should not focus on appearance until the end.
3. Make all object and information flows and connect them to process step boxes.
Next, draw items before and after each step. See your SIPOC diagram. The Supplier is your customer and the Customer is your Receiving Department. Since both are not shown in the following process steps, make their icons. Click on and use the ‘Customer Icon’ for your customers and the Department Icon for the Receiving Department and type its name on the icon.
The inputs from your customer are “Returned Products” and the other inputs are all information, so you need object flow and information flow icons.
Excel tips:
- Drag only an edge of the arrow and move it to another shape, then black points will appear on the shape. If you release your mouse on one of the black points, it turns into a green point. Now if you move the shape, the arrow will move with it.
- Another tip is this: Press the Ctrl key on your keyboard. While pressing it, drag and drop a shape. You can copy the shape very easily. Connect it to the box. Don’t focus on appearance so much here yet.
The outputs from this step are object flow and information flow icons. I’ll make and connect them. Repeat this on all of the following process steps. It will look like this.
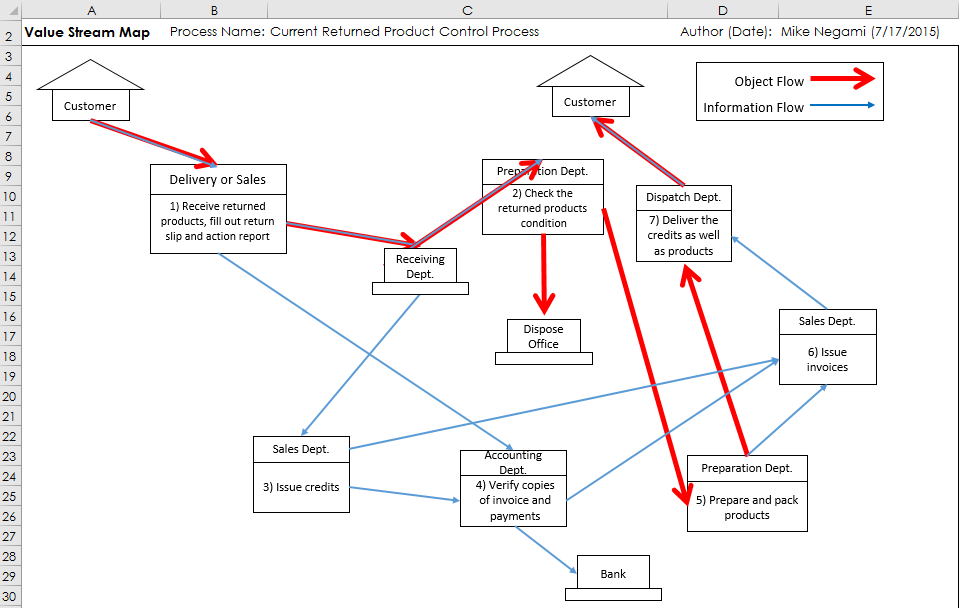
4. Complete the whole layout.
We’ll put the names of inputs and outputs, but before that, it’s better to finalize all the shapes’ layout, arrange them to not overlap each other’s arrows as much as you can.
Here is the 3rd Excel tip for today. While pressing the control key on your keyboard, click multiple shapes, then you can move them together.
This is the completion of our layout. You can move overlapped arrows little by little, by pressing arrow keys on your keyboard.

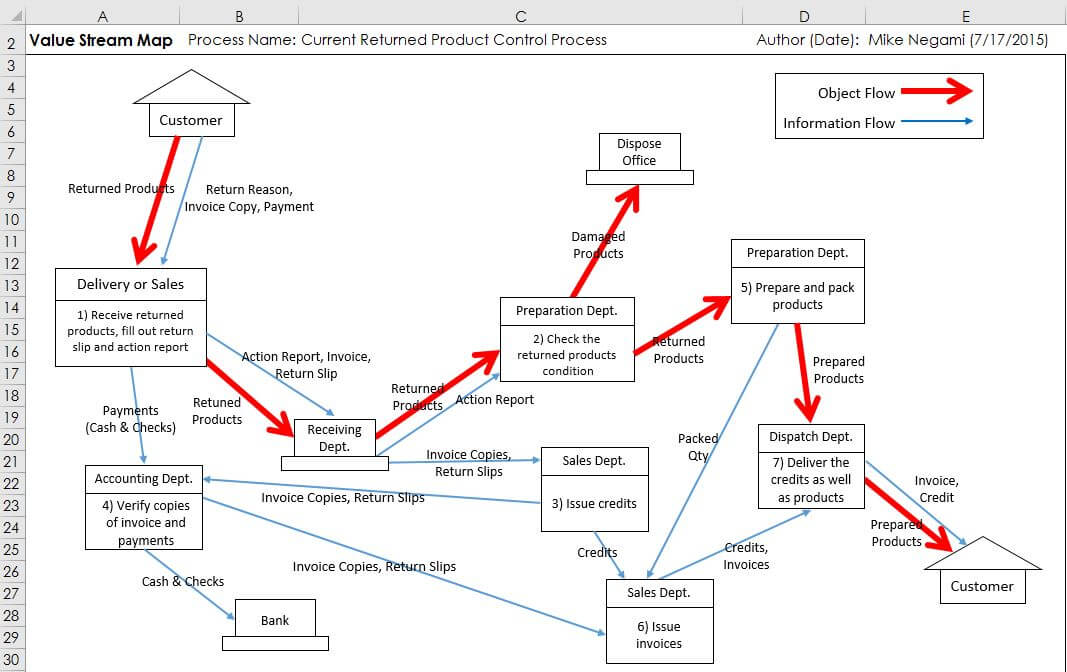
5. Put all object and information names in their textboxes.
Lastly, make names for objects and information items. An input from the customer is “Returned Products”. Click ‘Textbox’ and type it. Then put it around here.
The rest of the inputs are all information, so put them in another textbox. Repeat this on all outputs and inputs and here is the final completion of Value Stream Mapping.
Let me summarize all procedures:
- Conduct a SIPOC Analysis.
- Make all process step icons.
- Make all object and information flows and connect them to process step boxes.
- Complete the whole layout.
- Put all object and information names in their textboxes.
We practiced how to draw a Value Stream Map today. Please practice and master Value Stream Mapping using this template.
Thank you very much for viewing.