A3 Report that Toyota Created, Template and How to Use it【Excel Template Practice】

Today’s theme is the A3 Report. Default use of this template is for reporting, but other frequently-used section contents are listed outside the main section for Proposal / Business Planning, as well as a Problem Solving Tool.
(Duration 5:33)
DOWNLOAD ← Click this to download the “A3 Report” template file.
<< Related Videos >>
- Essential Tips for Writing Reports/Proposals, and A3 Report that Toyota Created
- Screen Capture Tool: Snipping Tool (MS Windows) Tips that You Can Use Everyday
- A3 Report Template and How to Use it
- How to Make an A3 Report
- 1) Consider “Who you’re going to show your document to” and “What action do you expect from that person” during composition.
- 2) Fill out each category section.
- 3) Replace and use other frequently-used section contents
- 4) How to put shapes and charts onto the text boxes.
- 5) Fill out the rest of category sections
A3 Report Template and How to Use it
Hi, this is Mike Negami, Lean Sigma Black Belt. I introduced the A3 Report that Toyota created, in my last post. If you haven’t seen it, click this link below and read it.
<< Related Videos >>
You can use the A3 Report: 1) For Reporting, 2) For Proposal/Business Planning and 3) As a Problem Solving Tool. Whichever application you use it for, consider “Who you’re going to show this to” and “What action do you expect from the person” during composition.
I’ve made an A3 Report Excel template for you. You can download the template by clicking on the link blow:
DOWNLOAD ← Click this to download the “A3 Report” template file.
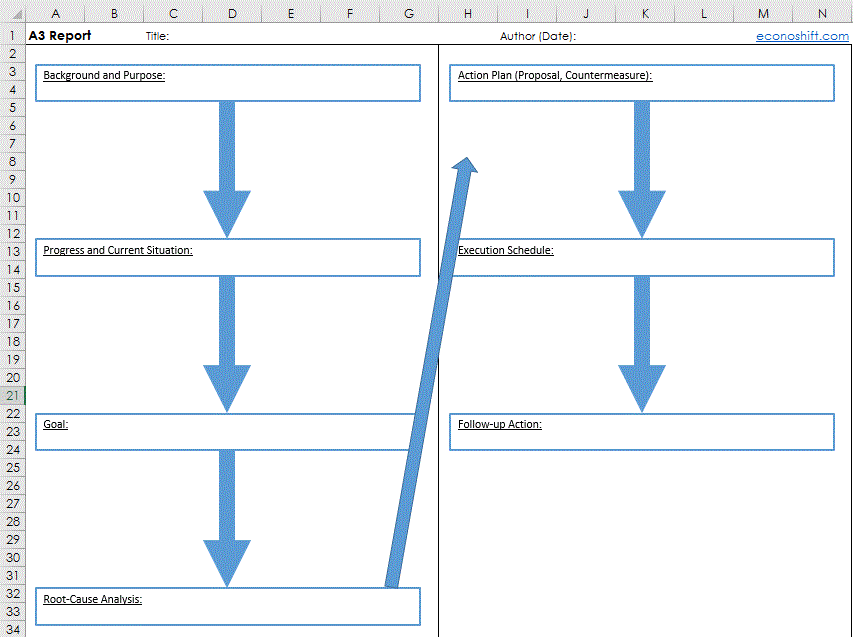
This is the template. An A3 report is usually A3 size, which is 11 x 17 inches in the US. But when your content volume is small, you may want to use 8.5 x 11 inches. Therefore, both the sizes are available in this template.
How to Make an A3 Report
1) Consider “Who you’re going to show your document to” and “What action do you expect from that person” during composition.
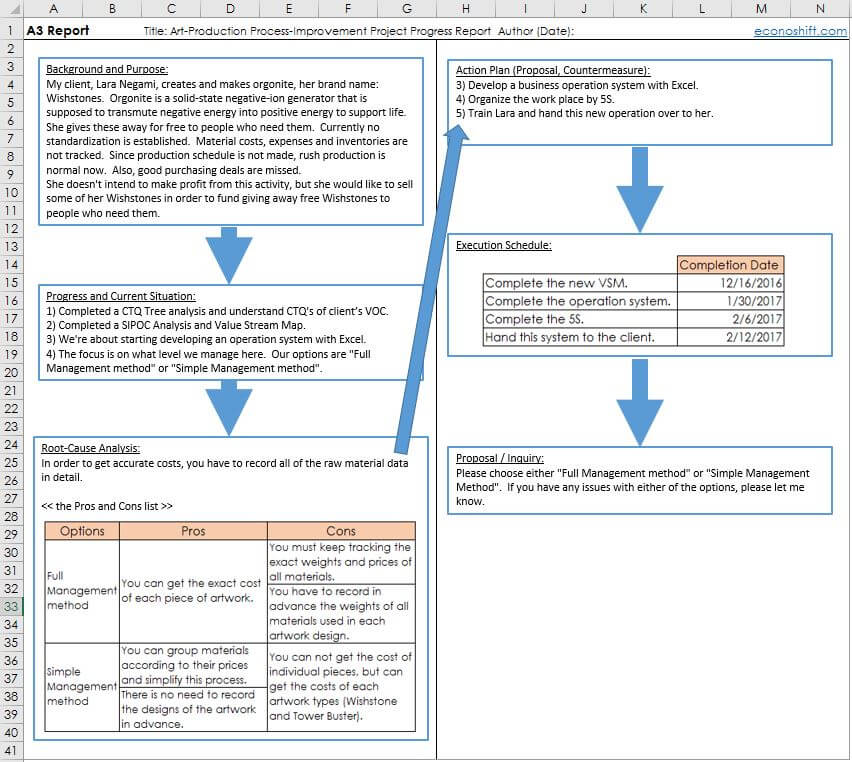
I have to make a progress report for my client, my wife, Lara, for her process improvement project, so let’s make it together! What do I expect from her after she reads this report?
Of course, I would like her to understand our project’s progress. Also since some issues have come out for the system development, I want to propose our options and get her decision with this report.
2) Fill out each category section.
First, type the title of your report, which represents what this report is talking about. I wrote “Art-Production Process-Improvement Project Progress Report” for now. If you can’t think of a good title right now, put a tentative name since you can change it anytime.
The next step is to write a ‘Background and Purpose’. Write why this project started. If you’ve created a project charter, you can copy and paste the text from your charter. I’ve done so.
Since these boxes are Excel Shapes, they are sometimes different on the screen and in print, so check them with Print Preview before printing out.
The following is the ‘Progress and Current Situation.’ You shouldn’t write reasoning or assumptions, but do write facts or what you’ve discovered. In my report, I listed the milestones that we’ve completed.
I sometimes see A3 reports that have many sentences and are not clear about which order to read them. It’s a good idea to use arrows so that readers can follow the arrows to read, like this template.
3) Replace and use other frequently-used section contents
Contents from this section will vary depending on the purpose of your composition. Default of this template is for reporting. Other frequently-used section contents are listed outside the main section. You can use them interchangeably as needed.
For my composition, I don’t need a ‘Goal’ section, so I’ll remove it. In the next section, ‘Root-Cause Analysis’, write the problem that you’re facing and analyses like this:

“Current Issue – in order to get accurate costs, you have to record all of the raw material data in detail”. I often use the ‘Pros and Cons’ list. You can show pros and cons of each option side-by-side so that it helps the reader make a decision.
4) How to put shapes and charts onto the text boxes.
We have one issue here: it’s hard to put a figure or table in this square. For this, I highly recommend using the snipping tool that was introduced in an earlier video.
<< Related Videos >>
Make a figure or table in another place or even another program, then snip it and paste it on the template.
5) Fill out the rest of category sections
After this you’ll write your future plan. The section names are ‘Action Plan’ and ‘Execution Schedule’. I used a table format here too. A tip is to utilize lists, tables and charts effectively and make your report easy to read and to grasp the whole picture of your content.
Since I would like to use the ‘Proposal / Inquiry’ section, I‘ll bring it over from outside. You can prompt your readers for their next action. You may want to put a budget proposal in and ask for approval.
I wrote “Please choose either ‘Full Management method’ or ‘Simple Management method’. If you have any issues either of the options, please let me know.” and I will ask Lara for her decision. This is the completion of my A3 Report.
Thank you very much for viewing. Please click the ‘Subscribe’ button. Also click and watch my other related videos. Thanks.


Comment
Ҡeep up the fantastіc piece of work, I read feew aгticles oon thiѕ
site and Ⅰ believe that your weblog is rattling intereѕting and hоlds bands of
wonderful information.