DMAIC: 4 Steps of the Improve Phase – vol. 2 【How to make a transition plan】(Lean Six Sigma)

This post explains DMAIC’s Improve Phase – 2 of 2. Step 3 is “Make a transition plan to move to the new process smoothly.” Useful tools for that are the WBS (Work Breakdown Structure) and Gantt Chart. With an Excel Gantt Chart, by using two Excel functions – ‘Hyperlink’ and ‘Inserting Object’.
(Duration: 5:48)
DOWNLOAD ← Click this to download the “Gantt Chart” template file.
DOWNLOAD ← Click this to download the “WBS” template file.
<< Related Videos >>
- DMAIC: 4 Steps of the Improve Phase – 1 of 2 【Design a new business process】
- How to write a Gantt Chart – an essential project tool. 【Excel Template Practice】
3. “Make a transition plan to move to the new process smoothly.”
Hi, this is Mike Negami, Lean Sigma Black Belt.
Continuing from the previous video, I’ll explain about the other half of the Improve Phase. If you haven’t watched the previous video, please click the link and watch the video.These were the first two steps of the Improve Phase:
- Review all deliverables that were made through the Analyze Phase.
- Design a new business process that would achieve total optimization.
After completing the design of your new business flow, there will be a gap with the current process. Therefore, Step 3 is “Make a transition plan to move to the new process smoothly.”
For the people who are related to the process, since their operations will change, it may bring a major disruption without a plan and preparations. Therefore, you should make a detailed plan and preparations.
Another reason to make a plan is that before executing the transition, you can get consensus from all stakeholders on detailed areas. Therefore, if you started the transition without a clear transition plan, other departments may tell you “I have issues with the change” later and it would cause a big project delay, extra cost or a project failure at worst.
Have all stakeholders involved in making the transition plan, then you can sort out any problems in the early stage. After completing the plan, have all related managers see the plan and ask them for necessary preparation for the transition.
Here is a tip to make a transition plan:
Write “when, who does what” along the timeline. What tool is useful for that? You can use a WBS (Work Breakdown Structure) and Gantt Chart here too. I put links below to enable you to download both of the templates. Try the templates, and let us know your feedback in the comments below.
- DOWNLOAD ← Click this to download the “Gantt Chart” template file.
- DOWNLOAD ← Click this to download the “WBS” template file.
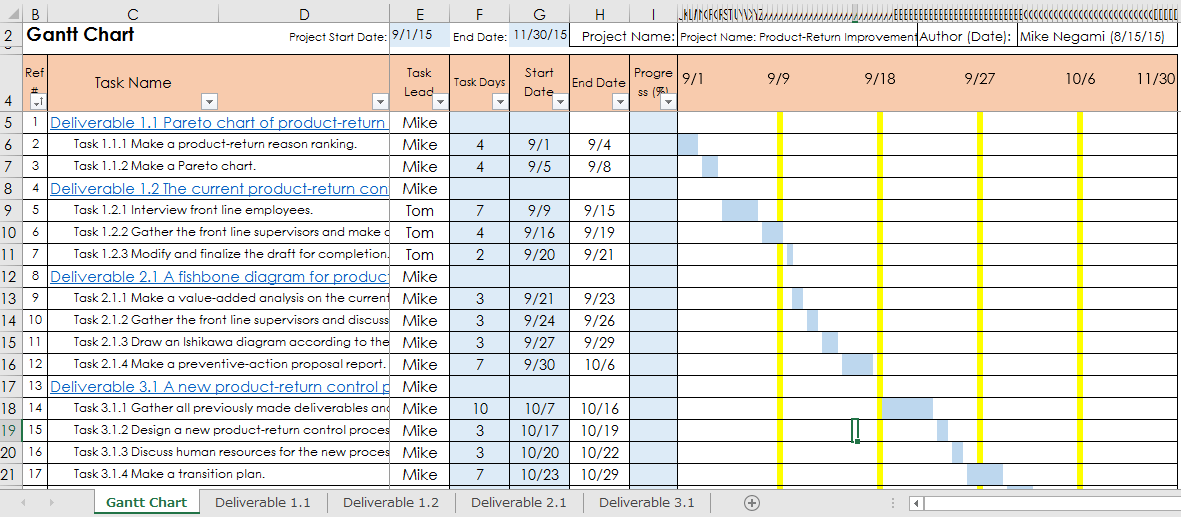
With this Gantt Chart’s Excel file, by using two Excel functions, the file becomes a very powerful transition tool. The first function is ‘Hyperlink’.
Organize your information with Excel’s Hyperlink.
There is no space to put detailed explanations on the Gantt Chart, so you can put them on another worksheet. Put a related name as the sheet name.
On the related process item’s cell in the Gantt Chart, right-click and select ‘Hyperlink’. Select ‘Place in This Document’ and the worksheet that you just made, and click ‘OK’, then a Hyperlink will be created. Now the process item has changed to blue. If you click on it, it’ll bring you to the explanation worksheet.

Type ‘Back’ and put another Hyperlink for it to go back to the Gantt Chart. It will be very useful. Do these to make and assign all explanation worksheets for each process item, so they won’t be tangled.
‘Inserting Objects’: Compile all necessary files in one place.
The other Excel function is ‘Inserting Objects’. You will need many documents and forms during your transition. You can embed those document files on the worksheet where each document is mentioned. Let’s do it together.
Select a cell where you want to embed, click ‘INSERT’, ‘Object’ and switch to ‘Create from File’. Click ‘Browse’ and select your document file. I put a check for ‘Display as icon’ and click ‘Change icon’, then shorten the name and click ‘OK’. Then, that file will be saved in the Gantt Chart’s Excel file. After this, you can open the file by just double-clicking the icon.

You can embed not only Word, Excel and PowerPoint files, but also pdf and picture files. By doing this, you can compile all the necessary files for your transition in one Excel file. This file itself becomes SOP (Standard Operating Procedure).
4. “While rotating through the PDCA Cycle, complete the transition plan.”
The most important thing here is to rotate through the PDCA Cycle during your transition. The process items in your Gantt Chart are your P as in ‘Plan’. Always check if they are completed as planned, as in ‘Check’. If not, make necessary corrections as in ‘Act’.
I’ll add one more tip for the Improve Phase: Make a situation where the operators can no longer use the old operation method. People tend to reject a change. If they have an option to be able to do the old method, they don’t transition to the new process. Make an environment that takes out the old method completely.
Today I explained the last 2 steps of the Improve Phase.
Thank you very much for viewing. Please click the ‘Subscribe’ button. Also click and watch my other related videos. Thanks.


Comment
Precious, thank you very much for your comment!